Versionen im Vergleich

Schlüssel

  • Diese Zeile wurde hinzugefügt.
  • Diese Zeile wurde entfernt.
  • Formatierung wurde geändert.
Seiteneigenschaften


Description:
Trace output can be used to check the internal processes in the LANCOM router during or after configuration, and as an aid to troubleshooting. A trace precisely logs the processes during connection establishment. The various parameters are recorded and can be examined for diagnostics. For example, traces can be used to display the individual stages of PPP negotiation. Experienced users who are able to understand this data can find the cause of connection failures, and they can provide useful information to LANCOM Support if necessary.
A trace can be started at the sender's end or at the receiver's end. An analysis of the resulting log files can, for example, help to find out which end is causing the problem during connection establishment.
Trace output has a slight time delay from the actual event, but the order of events is always recorded correctly. In general this does not influence the interpretation of the log file, but this should be considered when making precise analyses.
The first step when generating a trace is to create a configuration which defines the LANCOM router parameters for monitoring.


Requirements:


Procedure:

1) In LANconfig, right-click on the device entry and, from the context menu, select the option Create trace output.

...

Image Removed

Image Added
2) A new window opens. As of this point, you have two options for starting a trace.


Option 1: Guided configuration (with the help of a wizard)

1.1) Click in the left-hand window on the item Guided configuration and then on the button Start wizard.

Image Removed

Image Added

1.2) In the Trace wizard's Welcome dialog, click on the button Next.

Image Removed

Image Added

1.3) Select your problem to receive aid with troubleshooting. This allows the Trace wizard to create internal filters, which reduces the size of the log files. You have the option of limiting the log to a certain area. This example creates an ADSL trace.

Image Removed

Image Added

1.4) If you have already created a trace in the past (selection of parameters), you will be asked if this should be replaced. You also have the option of adding the new configuration to the old one.

Image Removed

Image Added

1.5) Click on the Finish button to exit the Trace wizard.

Image Removed

Image Added

1.6) The trace will be recorded by clicking on Start trace (green button).

Image Removed

Image Added

Information:
Info

While the trace is recording, repeat the action(s) that caused the error.

1.7) To end the trace recording, click on Stop trace (red Stop button).

Image Removed

Image Added

1.8) The recorded data can now by analyzed. The window is divided into two areas: In the upper area you see an index of the log entries. The trace output is displayed in the lower area.

Image Removed

Image Added

1.9) To save the trace data to a file, click on the disk icon in the menu bar.

Image Removed

Image Added

1.10) In the following dialog, specify the storage location and click on save.

Information:
Info

Two files are saved, a support configuration file (*.spf) and a trace file (*.lct). LANCOM Support requires both of these files in order to carry out an analysis.

Image Removed

Image Added

To analyze the trace data at a later time, you can reload the overview with the folder icon in the menu bar. Alternatively you can open the *.lct file with a double-click or click on the menu File

->

Load trace data.

Image Removed

Image Added

Image Removed

Image Added


Option 2: Expert configuration (manual trace)

As an alternative to working with the wizard, you can also start a trace after selecting one or more parameters manually.

2.1) You enter this mode by clicking on Expert configuration in the left-hand window, where you then select the required trace parameter(s). In this example, we shall be logging ADSL.

2.2) The trace will be recorded by clicking on Start trace (green button).

Image Removed

Image Added


Working with filters:

This document contains a number of trace configurations (*.lcg files) which can be used as templates. You can load these trace configurations directly into the Trace program with the menu item File

->

Load trace configuration.

Image Removed
The following trace configurations are available:
Trace parameter
Explanation
Trace configuration
IP routerThis trace configuration displays how the LANCOM router handles each TCP/IP packet, where the packet is being transmitted to, and whether it is being filtered.
FirewallThis trace configuration displays firewall events.
ADSLThis trace configuration displays the synchronization attempts for the ADSL connection.
WLANThis trace configuration displays information on activity in the wireless networks.
VPNThis trace configuration displays the connection establishment for the VPN connection.
VoIP (SIP only)This trace configuration displays the connection establishment for e.g. an IP telephone.
VoIP (with ISDN)This trace configuration displays the connection establishment for e.g. an ISDN telephone.
VoIP (with analog)This trace configuration displays the connection establishment for e.g. an analog subscriber.
VoIP (with ISDN and analog)This trace configuration displays the connection establishment for e.g. the analog and ISDN subscribers.

Image Added


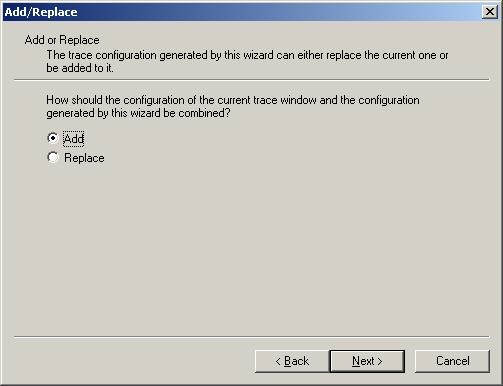
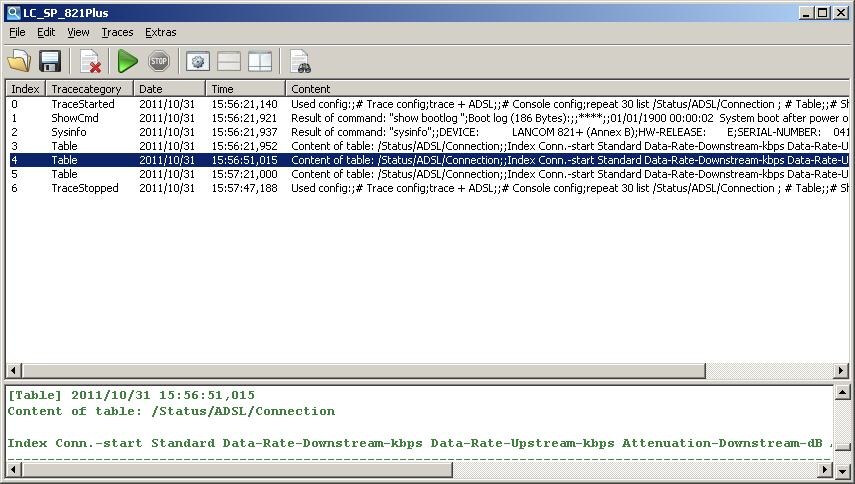
Potential error sources / notices:

Out-of-memory - trace disable

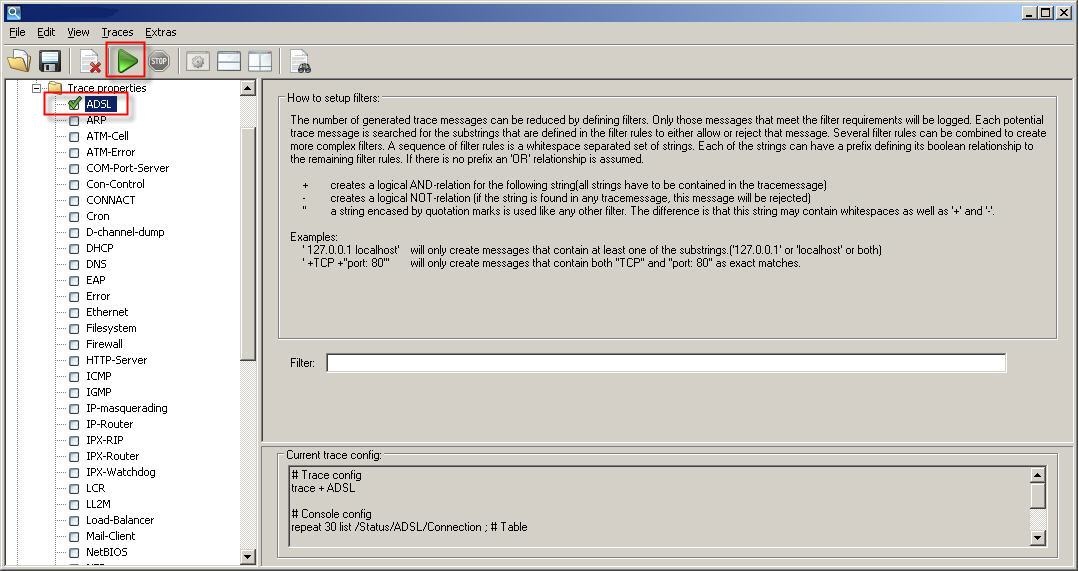
You can use filters to optimize your troubleshooting by examining only the relevant parameters. If you log too many parameters at once, you may have run out of memory space. This is in part due to the fact that, apart from saving the log file itself, the router has to perform its usual tasks, which also take up memory space (RAM). The logging procedure will be interrupted in this case. If this occurs, you should reduce the number of parameters being logged.

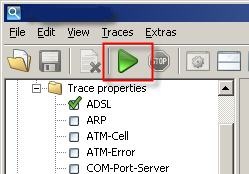
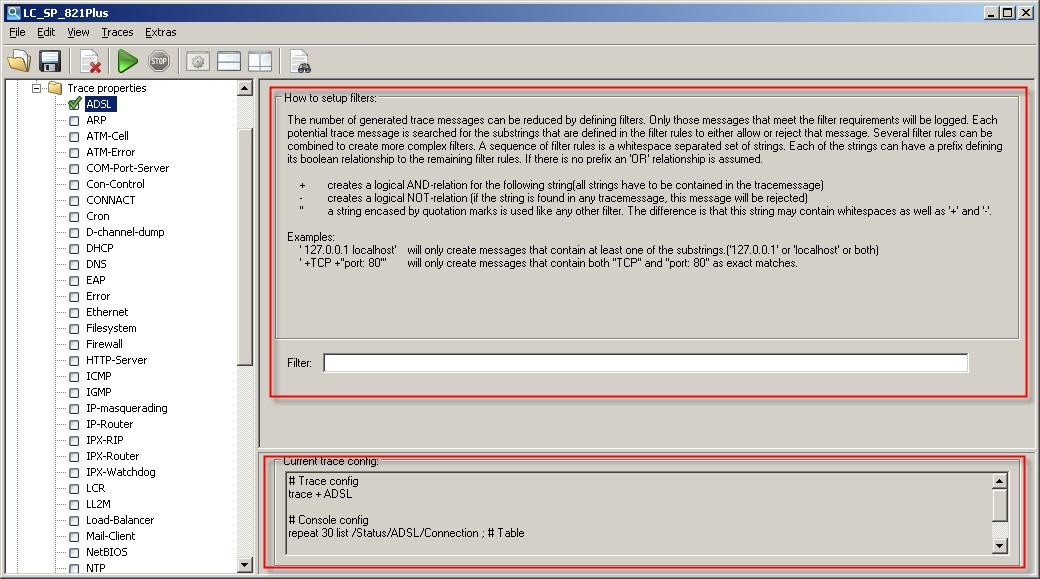
After selecting the parameters, the right-hand window displays a brief overview and some information on creating filters.

Image Removed

Image Added