Description:
The Spectral Scan software module enables you to run a spectral analysis directly on the access point. There is no need to purchase any additional software or hardware as the integrated features can be used to analyze the frequency ranges and bands in question. This gives you a graphical overview of the frequency response characteristics within your WLAN at all times so that you can detect interference and safeguard against it.
Spectral analysis can also clarify or identify the following:
- Proper, fault-free operation of the WLAN
- Existence of interference or noise
- Display or identify the bands with interference
- Strength of the interference signal
- Regularity or frequency of the interference signal
- Type, and possibly source, of the interference signal
The Spectral Scan feature is a component of the LANCOM Active Radio Control (ARC)  . .
Requirements:
- LLANCOM Access Points of the L-4xx, L-32x, L-8xx, L-13xx, LN-8xx, LN-17xx series, and models of the 178x series with WLAN as well as the 883 VoIP
Procedure:
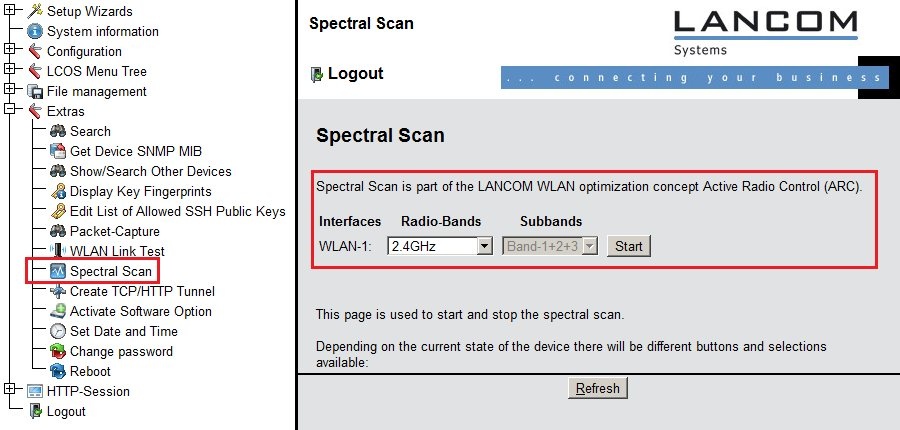
1) Open the configuration for the LANCOM access point in WEBconfig and switch to the menu item Extras -> Spectral Scan.
Information:
The spectral scan can also be started from the
LANmonitor . To do this, right-click the relevant device in the list and select
Show spectral scan in the context dialog. A
browser window opens showing you the same entries, buttons and selection menus as those in WEBconfig.
The Spectral Scan menu offers the following functions:
- Interfaces:
Shows the selected WLAN module for analysis. For dual-radio access points, a selection is shown here.
- Radio bands:
Here you specify the radio bands to be analyzed before the spectral analysis is started. If it has started already, the selection is shown and the field is grayed out.
- Subbands:
This selection menu is only enabled if 5GHz or 2.4GHz/5Ghz is selected in Radio bands. You are then able to specify which subbands of the 5GHz band are included in the analysis.
- Start:
This button launches the Spectral Scan on the corresponding WLAN module. A separate window is opened for each selected frequency band. The WLAN module is unavailable for data transfer while the Spectral Scan is operating.
- Stop:
This exits the Spectral Scan. The WLAN module returns to its previous operating mode and the usual functions become available again. This button is only shown once the module has been started.
- Show:
If the spectral scan has started, a click on this button opens a window for each selected frequency band.
2) Set the desired parameters and then press Start. The Spectral Scan is run.
Information:
During the analysis, the WLAN module being analyzed does not send any data or transmit any SSID.
The spectral scan is displayed in a browser application. For this to work properly,
your browser WebSockets must support the HTML5 element <canvas>. The
browser in LANmonitor meets all of these requirements.
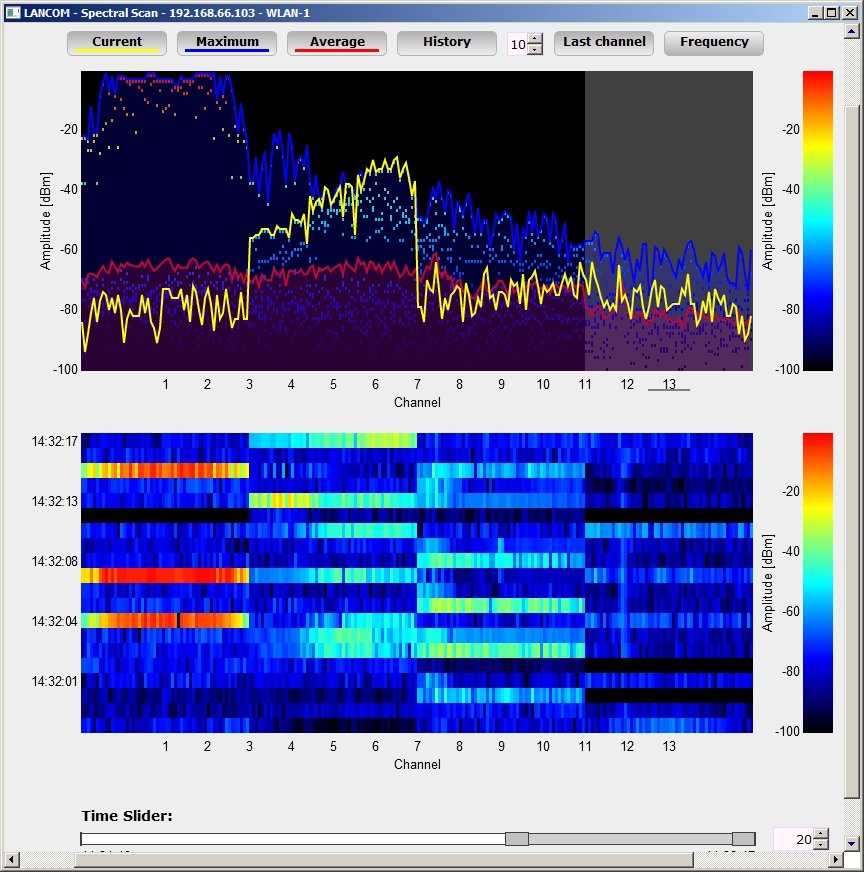
In the separate analysis window of the Spectral Scan, there are different ways to show the frequencies and frequency ranges along with any potential interference. The following buttons are available at the top of the window:
- Current:
Shows or hides the curve of the values being measured.
- Maximum:
Shows or hides the maximum values of the ongoing spectrum scan in relation to the currently set history range.
- Average:
Shows or hides the average values of the ongoing spectral scan in relation to the currently set history range.
- History:
Shows or hides the values last measured.
- Number of history values:
Determines the number of the most recent results to be displayed. You are able to show at least the last 5 and at most the last 50 measuring points for every frequency.
- Last channel:
Shows or hides the channel last used.
- Frequency:
Switches the display on the X-axis between WLAN channel and frequency.
The window contains two graphical views showing the readings in a different manner. The top diagram shows the signal strength in dBm on the Y-axis, and either the WLAN channel or the relevant frequency on the X-axis. The lower diagram contains the analysis progression over time in the form of a waterfall diagram, with the Y-axis showing the time and the X-axis again showing the WLAN channel or the relevant frequency.
These view formats depict both continuous and occasional interference on the frequencies, so helping you to take appropriate action to improve the connection (e.g. by changing the channel or identifying and eliminating the interference source). For example, certain interference sources such as microwave devices, DECT telephones (working in the 2.4GHz frequency range) and audio-video transmitters exhibit very typical transmit patterns that occur prominently in both diagrams.
On the lower border of the window is a slider denoted Time slider. This enables you to extend or limit the time period analyzed in the waterfall diagram. Alternatively, you can use the input box to the right of the slider to select how many readings you would like to display in the waterfall diagram. The web application can display up to 300 readings in the waterfall diagram using the time slider. The readings from a maximum of 24 hours can be cached. |
|
